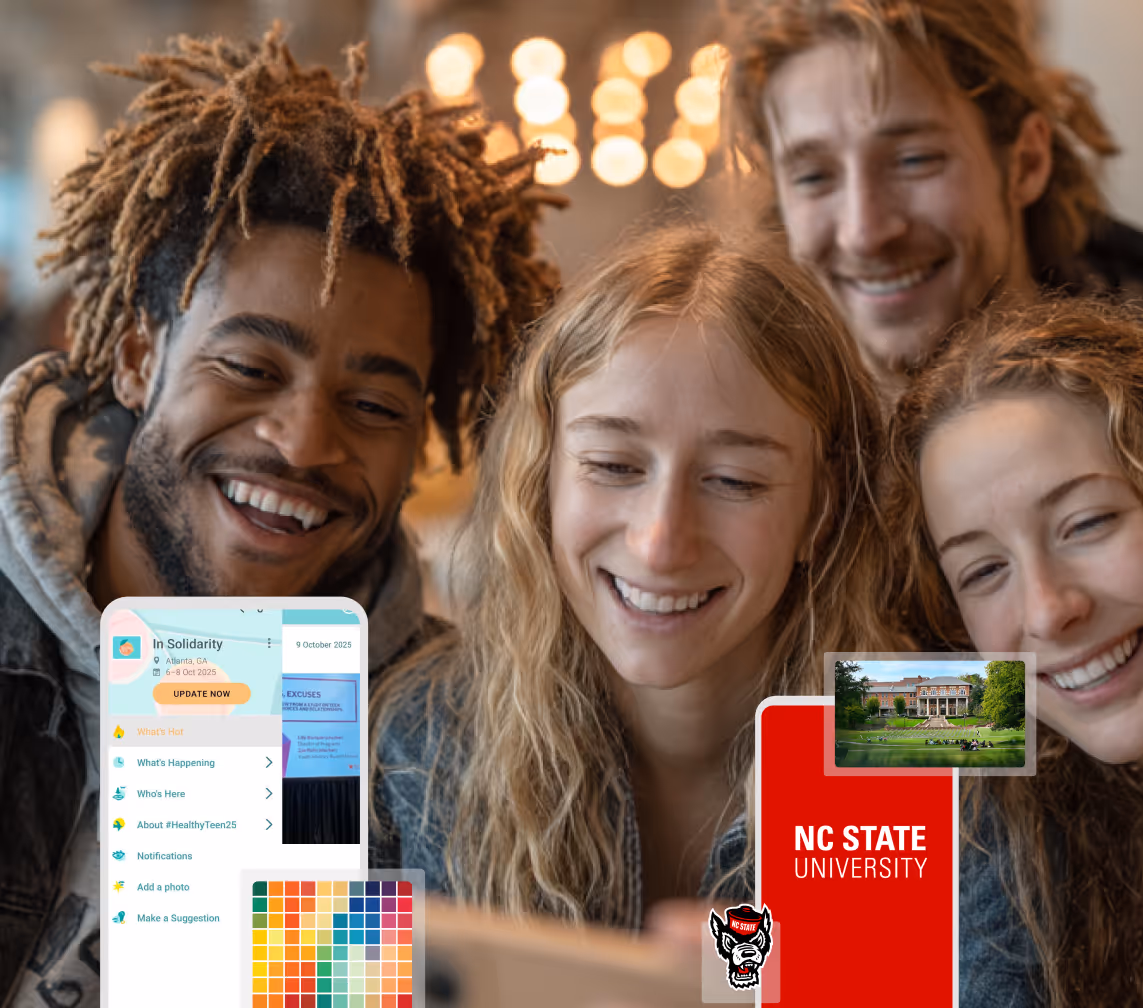
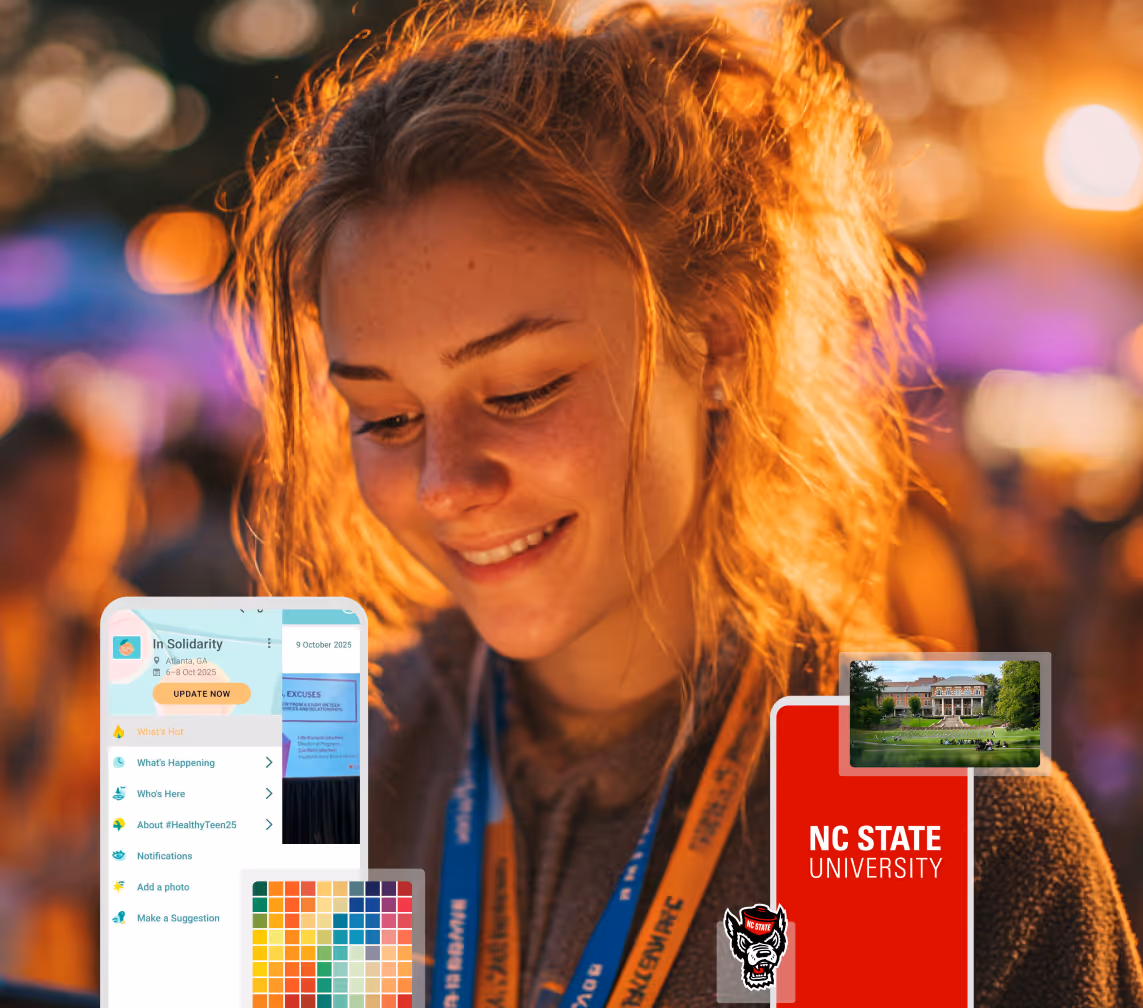
A Smaller School?
Deliver a polished, branded event experience without a large team or a big budget.
A Smaller School?
Deliver a polished, branded event experience without a large team or a big budget.
Running Family Programs?
Give families everything they need, from schedules and maps to real-time updates, all in one place.
Running Family Programs?
Give families everything they need, from schedules and maps to real-time updates, all in one place.
Coordinating Move-In Day?
Share updates, manage events, and keep students informed from move-in through the academic year.

Coordinating Move-In Day?
Share updates, manage events, and keep students informed from move-in through the academic year.
Offering Campus Tours?
Deliver branded, self-guided tour experiences with interactive maps and rich media, available 24/7.

Offering Campus Tours?
Deliver branded, self-guided tour experiences with interactive maps and rich media, available 24/7.
Organising a Career Fair?
Simplify logistics for students, employers, and Career Services staff with one easy-to-use app.
Organising a Career Fair?
Simplify logistics for students, employers, and Career Services staff with one easy-to-use app.
Managing Alumni Events?
Plan reunions, regional events, and fundraising campaigns with an app built for alumni engagement.

Managing Alumni Events?
Plan reunions, regional events, and fundraising campaigns with an app built for alumni engagement.
Boost Student Engagement
One hub for schedules, resources, and events that keeps students connected throughout the academic year.
Boost Student Engagement
One hub for schedules, resources, and events that keeps students connected throughout the academic year.
Planning Orientation?
Help new students feel prepared from day one with schedules, campus resources, and real-time updates in one app.
Planning Orientation?
Help new students feel prepared from day one with schedules, campus resources, and real-time updates in one app.
Running Admissions Events?
Manage open houses, tours, and yield events with a branded app that saves time and engages prospective students.

Running Admissions Events?
Manage open houses, tours, and yield events with a branded app that saves time and engages prospective students.
Get a custom Sponsorship Package Template
Stop starting from scratch. Grab free templates that helWe'll build a tailored sponsorship package with suggested pricing, tiers, and benefits..for your specific event.p you build professional sponsorship packages and close deals faster.
Get a custom Sponsorship Package Template
Stop starting from scratch. Grab free templates that helWe'll build a tailored sponsorship package with suggested pricing, tiers, and benefits..for your specific event.p you build professional sponsorship packages and close deals faster.
Plan Your Next Event Without Missing a Beat.
From venue selection to post-event wrap-up, this free checklist walks you through every step (so nothing falls through the cracks).
.avif)
Plan Your Next Event Without Missing a Beat.
From venue selection to post-event wrap-up, this free checklist walks you through every step (so nothing falls through the cracks).
Real Results From Real Events
100,000+ organizations trust Guidebook. See exactly how universities, associations, enterprises, and more put it to work.

Real Results From Real Events
100,000+ organizations trust Guidebook. See exactly how universities, associations, enterprises, and more put it to work.
Flexible pricing for every event size
Find the perfect plan for your needs, from intimate gatherings to large-scale conferences.

Flexible pricing for every event size
Find the perfect plan for your needs, from intimate gatherings to large-scale conferences.
Join our event experts
Watch on-demand webinars and join live sessions with industry leaders sharing best practices for event success.
.avif)
Join our event experts
Watch on-demand webinars and join live sessions with industry leaders sharing best practices for event success.
Guidebook in Action
Book a personalized walkthrough and discover how we help event teams create better attendee experiences.
Guidebook in Action
Book a personalized walkthrough and discover how we help event teams create better attendee experiences.
- webinars.sponsorship packages.
- Benchmarking Capability: Year-over-year comparisons show whether your events are improving. You need historical data to spot trends.
- Real-Time Accessibility: Staff and leadership need dashboards they can actually understand—not spreadsheets that require a data scientist to interpret.
General Event Metrics
- Scope: Basic attendance counts and satisfaction scores
- Focus: Individual event performance
- Timeline: Post-event reporting only
- Channels: Registration and surveys
- Goal: Measure what happened
- Scope: Comprehensive member journey tracking across all touchpoints
- Focus: Long-term member value and organizational health
- Timeline: Before, during, and after events with historical comparison
- Channels: Registration, app engagement, session tracking, networking, and post-event behavior
- Goal: Drive strategic decisions and prove event ROI
- Scope: Campaign performance and conversion tracking
- Focus: Promotional effectiveness
- Timeline: Pre-event emphasis
- Channels: Email, social media, advertising
- Goal: Maximize registrations
Registration and Attendance Metrics
Start with the basics. Track total registrations, show-up rates, and no-show patterns. But go deeper for associations.
Segment by member status: first-time attendees, lapsed members, and loyal regulars. This reveals whether your events attract new faces or just the usual crowd. Compare early-bird vs. late registrations to optimize your event registration timeline.
Session and Content Engagement
Track these specifics:
- Session attendance vs. capacity
- Drop-off rates (people who left early)
- Repeat attendees across multiple sessions
- Content downloads and resource access
- Q&A participation rates
Networking and Connection Data
Modern event check-in software and mobile apps track meeting requests, contact exchanges, and community feature usage. These numbers prove your event delivers networking value—something members can't get from a webinar recording.
Sponsor and Exhibitor Performance
Your sponsors want data. Give them booth traffic counts, lead scans, and session attendance for sponsored content.
This isn't just about keeping sponsors happy. It's about pricing your packages correctly and attracting better partners next year.
Post-Event Behavior Tracking
Connect your event data to your AMS (Association Management System) to see the full picture.
Define Success Before the Event
What does a successful event look like for your association? Get specific.
Vague goals like "great attendance" don't help. Try these instead:
- 15% increase in first-time attendees
- 85% session capacity utilization
- 90% sponsor renewal rate
- 20% of attendees engage with the mobile app daily
Choose the Right Technology Stack
An event management platform should integrate with your registration system, mobile app, and member database. Siloed data creates blind spots. Guidebook's platform connects these pieces, giving associations a complete view of member engagement.
Create Reporting Dashboards
Raw data overwhelms people. Dashboards tell stories.
Build different views for different audiences:
- Board reports: High-level ROI and membership impact
- Staff dashboards: Operational metrics and real-time alerts
- Sponsor reports: Engagement and lead generation stats
Establish Benchmarks and Comparisons
One year of data tells you what happened. Multiple years tell you where you're headed.
Document everything. Even disappointing numbers become valuable when you can show improvement over time. Industry benchmarks from similar associations add context to your results.
For Event Success:
- Resource Allocation: Stop guessing where to spend your budget. Data shows what actually moves the needle.
- Real-Time Adjustments: Spot problems during the event—like an overcrowded session—and fix them immediately.
- Speaker Selection: Session ratings and attendance data help you book better presenters.
- Format Innovation: Test new session formats and measure results. Let data guide your experiments.
For Business Objectives:
- Membership Retention: Prove that event attendees renew at higher rates than non-attendees.
- Revenue Growth: Use engagement data to justify premium pricing and attract bigger sponsors.
- Board Confidence: Give leadership the numbers they need to support your event strategy.
- Strategic Planning: Multi-year trends inform long-term decisions about event frequency, location, and format.
- Competitive Positioning: Show prospective members and sponsors why your events outperform alternatives.
- Start Collecting Data Early: Begin tracking from the first registration. Pre-event surveys and registration questions establish baseline data you'll need later.
- Use Mobile Apps for Passive Data Collection: Apps track session check-ins, content views, and networking activity without requiring manual input. This gives you richer data with less attendee friction.
- Connect Event Data to Your AMS: The real magic happens when you link event behavior to membership outcomes. Did conference attendees renew at higher rates? You need integrated systems to answer that.
- Survey Strategically, Not Excessively: Post-event surveys matter, but response rates drop when you ask too much. Focus on 5-10 essential questions. Use app data to fill gaps.
- Share Results with Stakeholders Quickly: Sponsors want data within two weeks. Your board wants it for the next meeting. Build reporting templates in advance so you can deliver fast.
- Document Your Methodology: How did you calculate ROI? What counts as "engaged"? Write it down. Consistent methodology makes year-over-year comparisons meaningful.
- Benchmark Against Similar Associations: Join industry groups that share anonymized data. Knowing your peers' numbers adds context to your own.
Tracking Too Many Metrics: More data isn't better data. When you track 50 metrics, nothing stands out. Focus on 10-15 KPIs that directly connect to your goals. Everything else is noise.
Ignoring Qualitative Feedback: Numbers tell you what happened. Comments tell you why. Don't dismiss open-ended survey responses or social media sentiment. They add crucial context.
: You can't measure what you didn't track. Define your metrics and set up data collection before registration opens. Retrofitting analytics never works well.Presenting Data Without Context: "500 people attended" means nothing without comparison. Was that up or down from last year? How does it compare to capacity? Always provide benchmarks.
: Event data should inform marketing, membership, education, and leadership decisions. Share insights across teams. Break down the silos.: Your sponsors fund a significant portion of your events. If you can't prove their ROI, they'll take their money elsewhere. Prioritize sponsor-facing metrics and reports.Final Thoughts
The associations that thrive in coming years will be the ones that treat data as a strategic asset. They'll know exactly which events drive membership, which sessions spark engagement, and which sponsors deserve premium placement. That knowledge compounds over time.
Join 5000+ other
**event planners** today
From Fortune 500s to universities to local nonprofits, teams trust Guidebook to save time, reduce chaos, and delight attendees.
.avif)