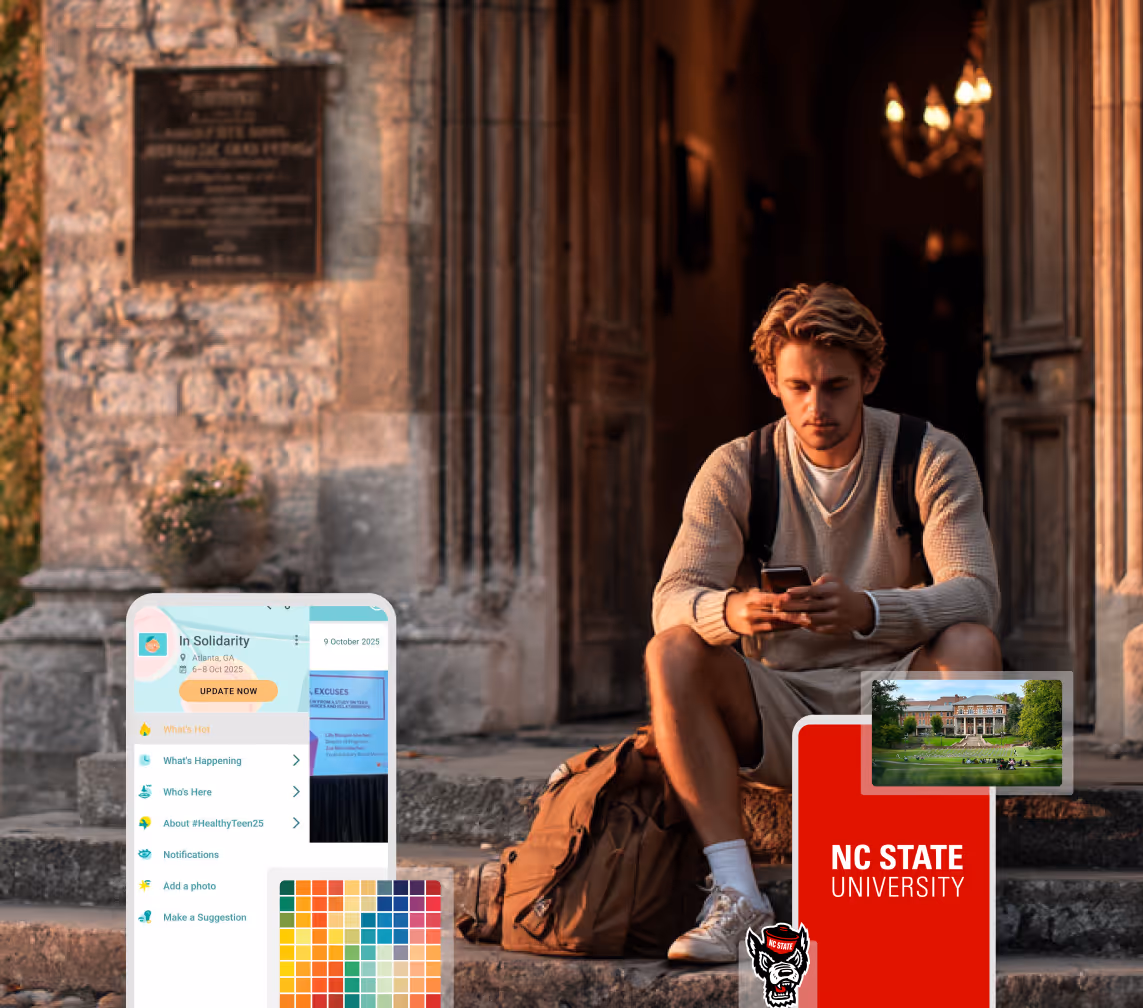
A Smaller School?
Deliver a polished, branded event experience without a large team or a big budget.
A Smaller School?
Deliver a polished, branded event experience without a large team or a big budget.
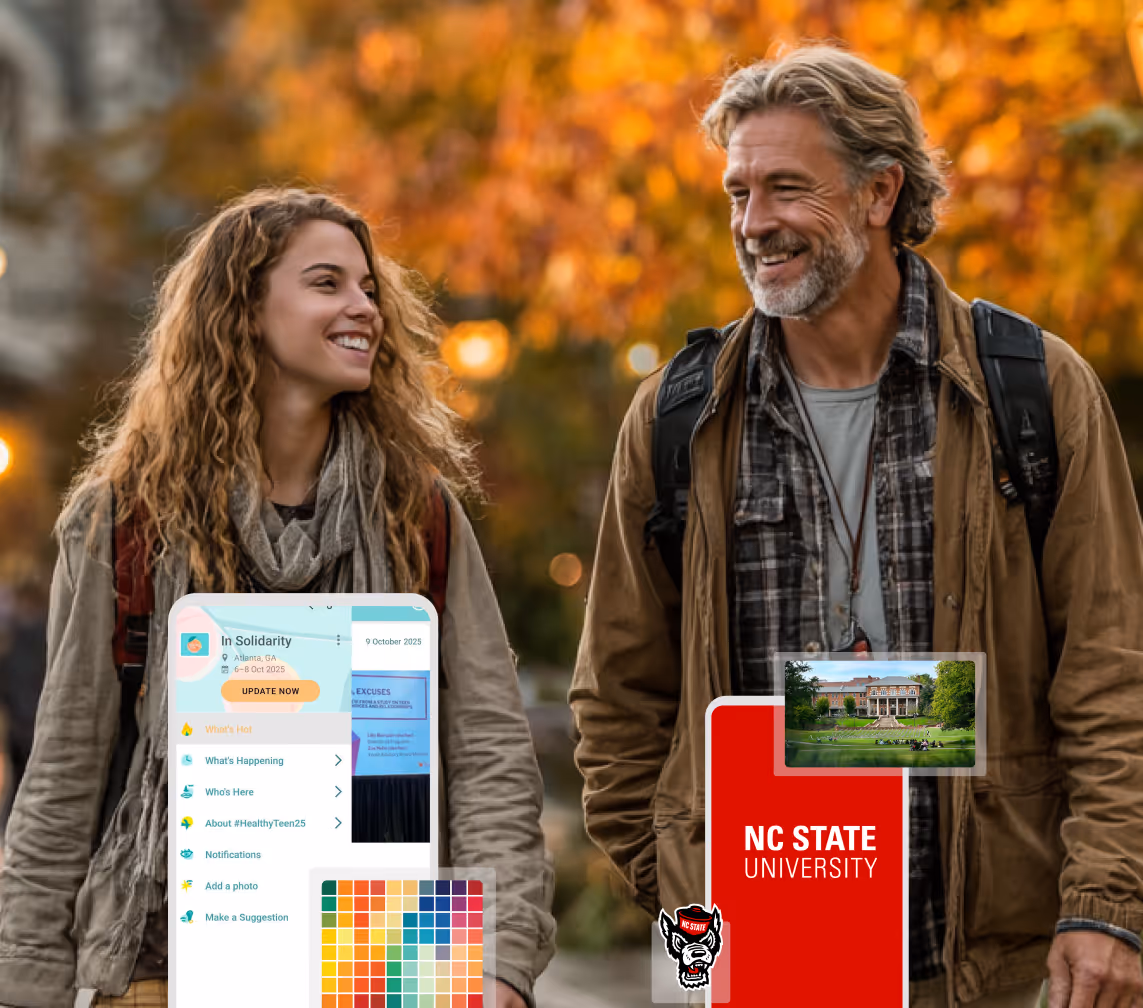
Running Family Programs?
Give families everything they need, from schedules and maps to real-time updates, all in one place.
Running Family Programs?
Give families everything they need, from schedules and maps to real-time updates, all in one place.
Coordinating Move-In Day?
Share updates, manage events, and keep students informed from move-in through the academic year.

Coordinating Move-In Day?
Share updates, manage events, and keep students informed from move-in through the academic year.
Offering Campus Tours?
Deliver branded, self-guided tour experiences with interactive maps and rich media, available 24/7.

Offering Campus Tours?
Deliver branded, self-guided tour experiences with interactive maps and rich media, available 24/7.
Organising a Career Fair?
Simplify logistics for students, employers, and Career Services staff with one easy-to-use app.
Organising a Career Fair?
Simplify logistics for students, employers, and Career Services staff with one easy-to-use app.
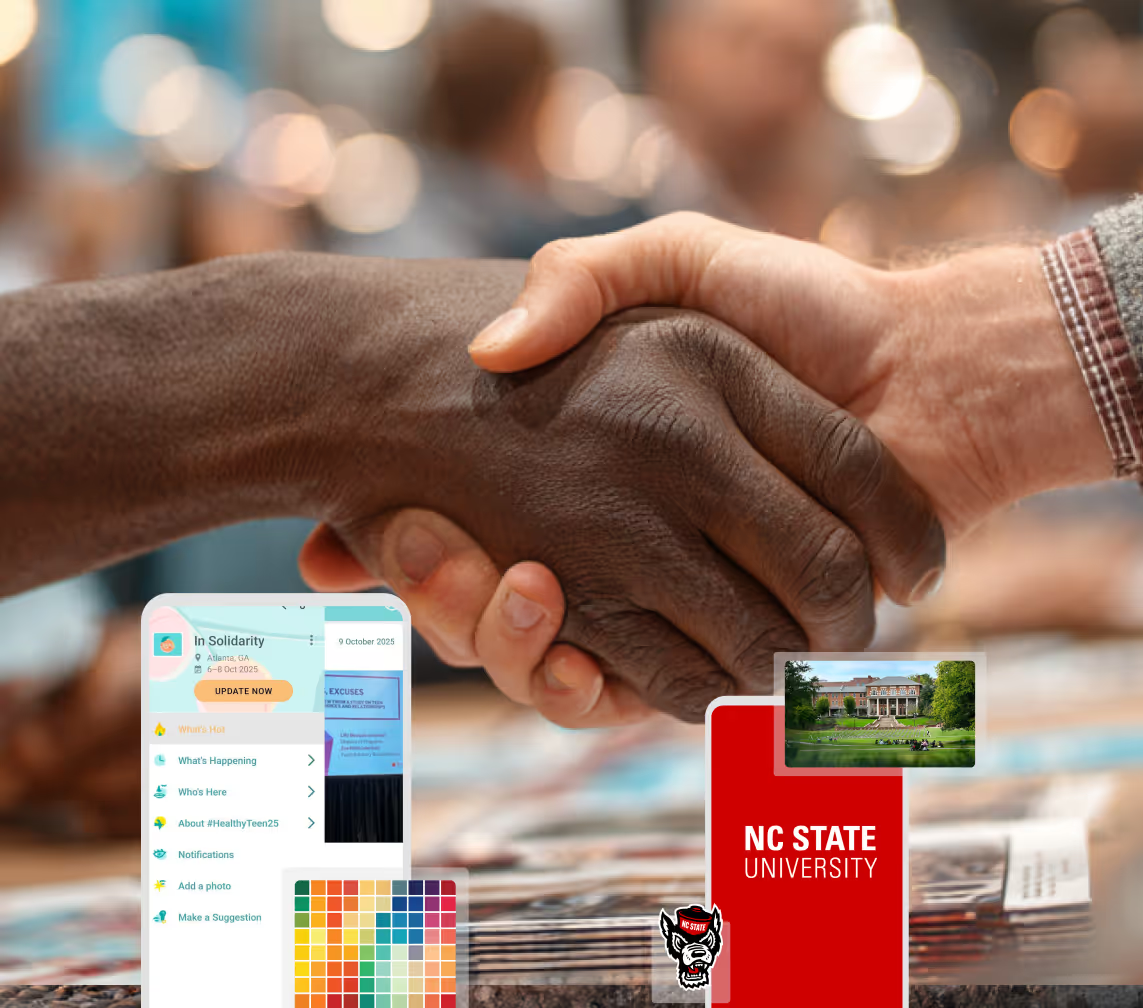
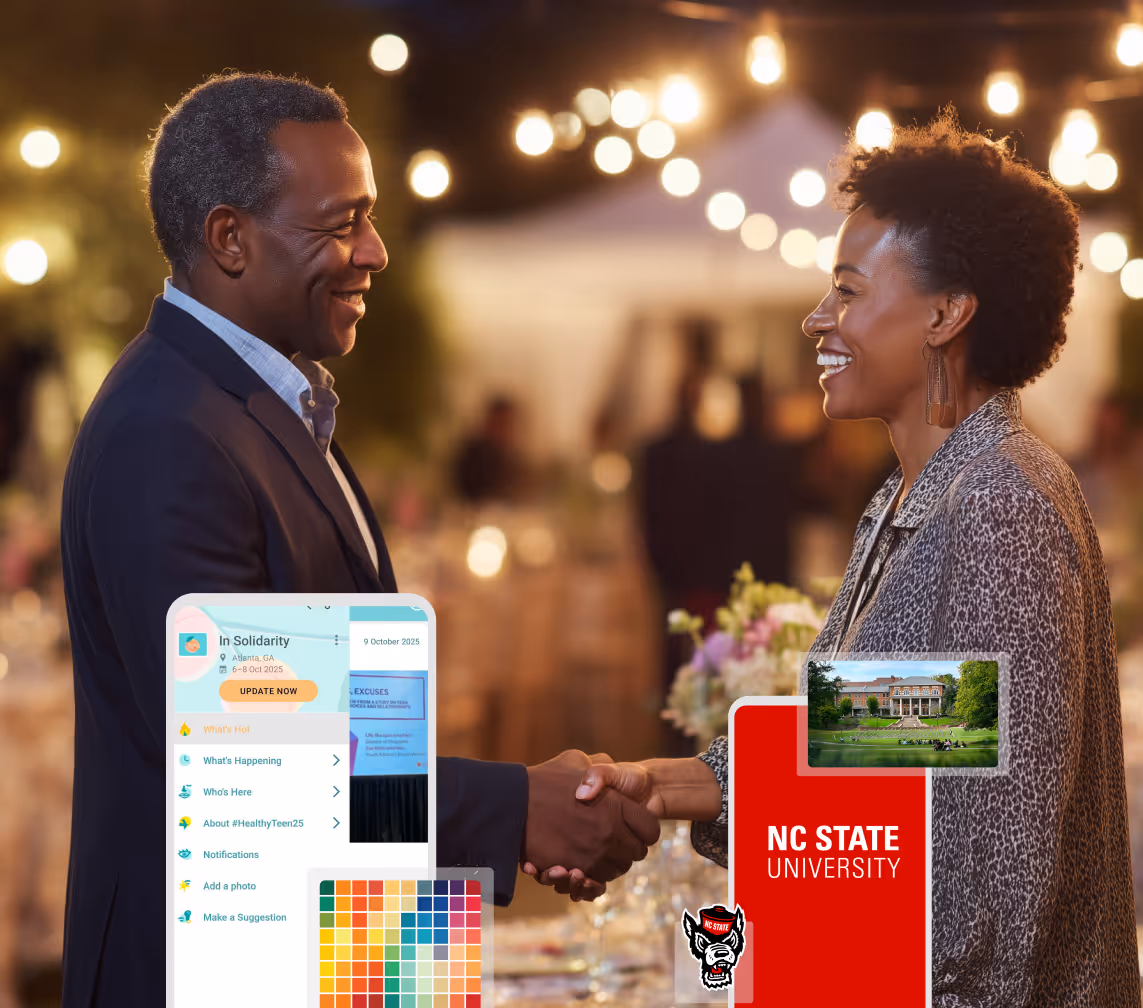
Managing Alumni Events?
Plan reunions, regional events, and fundraising campaigns with an app built for alumni engagement.
Managing Alumni Events?
Plan reunions, regional events, and fundraising campaigns with an app built for alumni engagement.
Boost Student Engagement
One hub for schedules, resources, and events that keeps students connected throughout the academic year.
Boost Student Engagement
One hub for schedules, resources, and events that keeps students connected throughout the academic year.
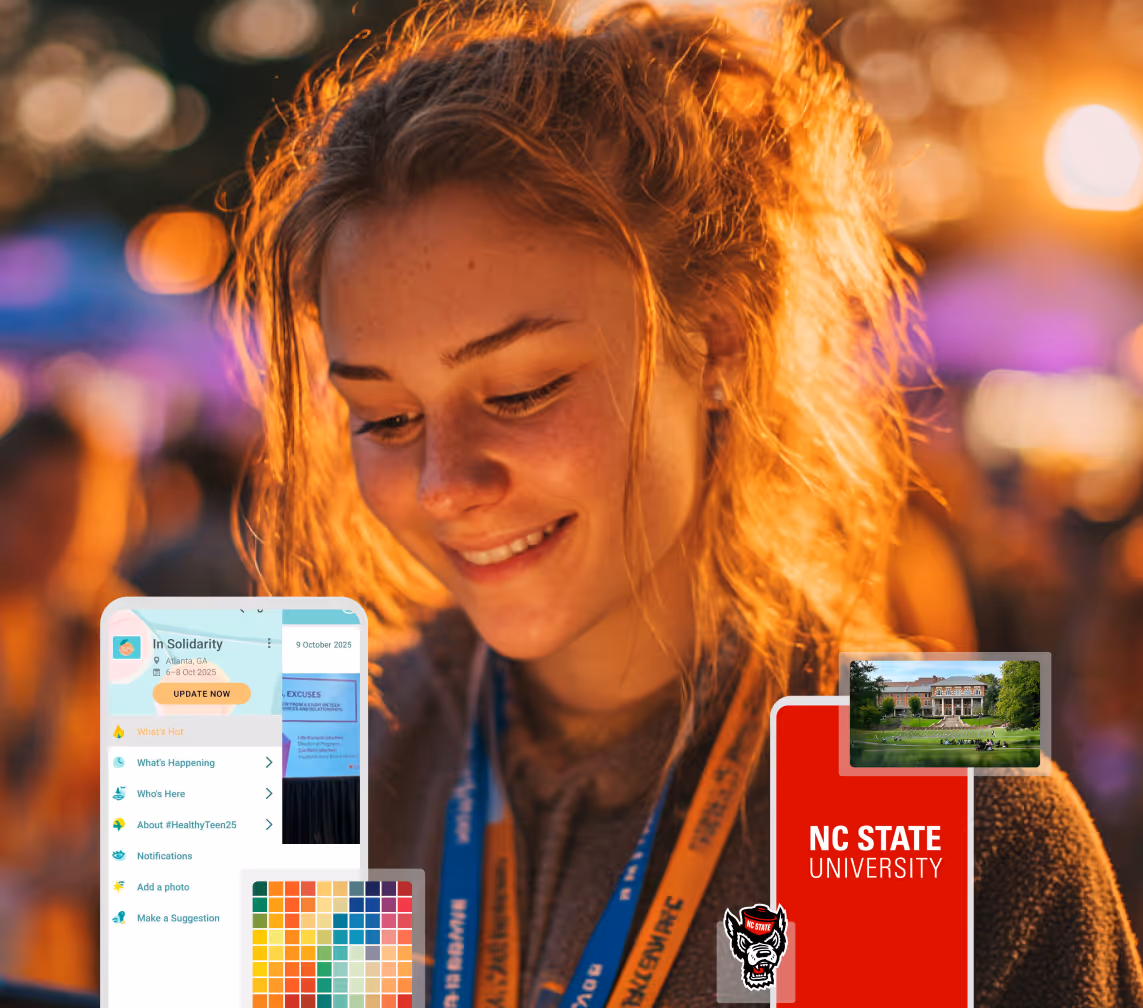
Planning Orientation?
Help new students feel prepared from day one with schedules, campus resources, and real-time updates in one app.
Planning Orientation?
Help new students feel prepared from day one with schedules, campus resources, and real-time updates in one app.
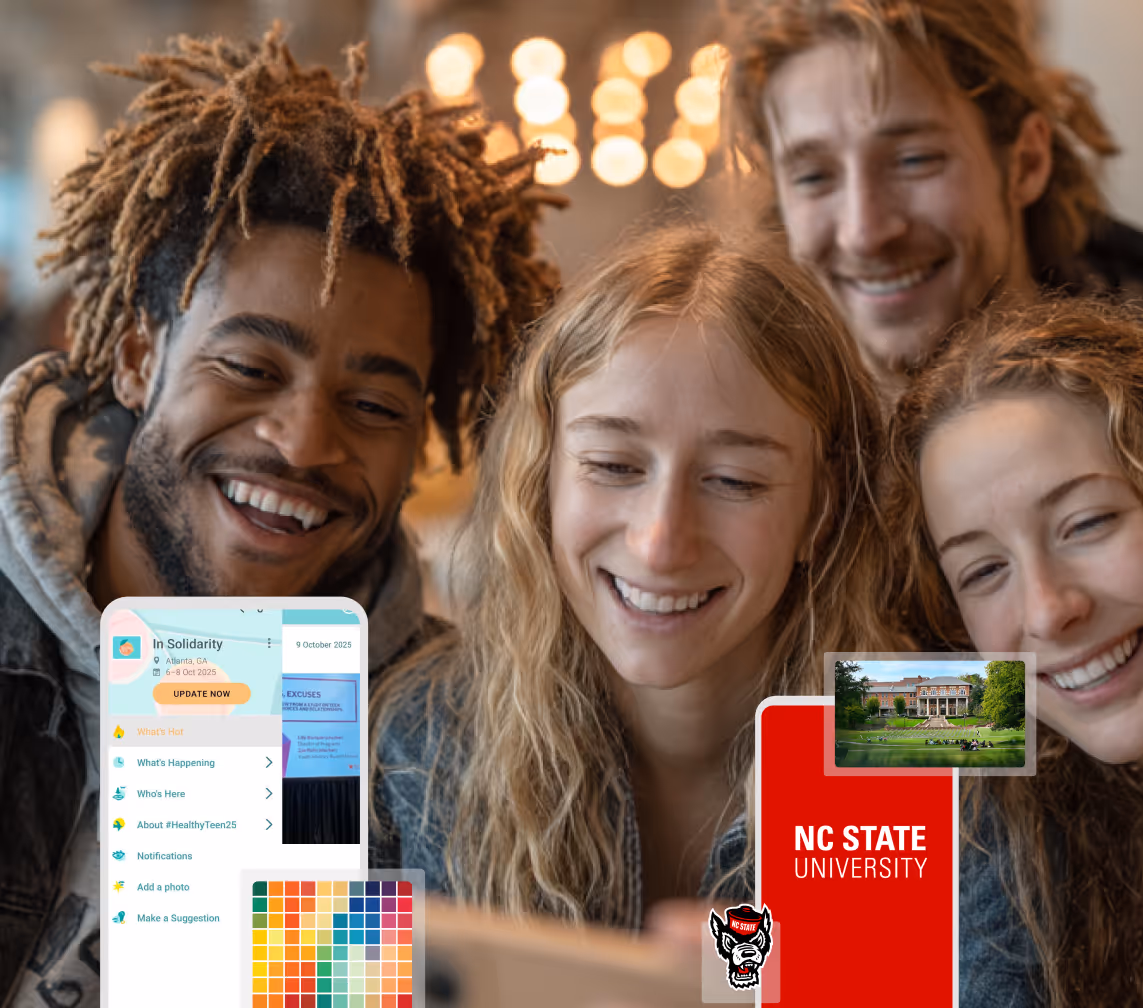
Running Admissions Events?
Manage open houses, tours, and yield events with a branded app that saves time and engages prospective students.

Running Admissions Events?
Manage open houses, tours, and yield events with a branded app that saves time and engages prospective students.
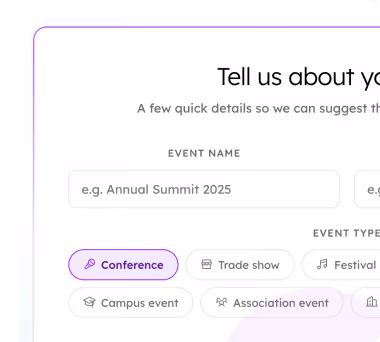
Get a custom Sponsorship Package Template
Stop starting from scratch. Grab free templates that helWe'll build a tailored sponsorship package with suggested pricing, tiers, and benefits..for your specific event.p you build professional sponsorship packages and close deals faster.
Get a custom Sponsorship Package Template
Stop starting from scratch. Grab free templates that helWe'll build a tailored sponsorship package with suggested pricing, tiers, and benefits..for your specific event.p you build professional sponsorship packages and close deals faster.
Plan Your Next Event Without Missing a Beat.
From venue selection to post-event wrap-up, this free checklist walks you through every step (so nothing falls through the cracks).
.avif)
Plan Your Next Event Without Missing a Beat.
From venue selection to post-event wrap-up, this free checklist walks you through every step (so nothing falls through the cracks).
Real Results From Real Events
100,000+ organizations trust Guidebook. See exactly how universities, associations, enterprises, and more put it to work.

Real Results From Real Events
100,000+ organizations trust Guidebook. See exactly how universities, associations, enterprises, and more put it to work.
Flexible pricing for every event size
Find the perfect plan for your needs, from intimate gatherings to large-scale conferences.

Flexible pricing for every event size
Find the perfect plan for your needs, from intimate gatherings to large-scale conferences.
Join our event experts
Watch on-demand webinars and join live sessions with industry leaders sharing best practices for event success.
.avif)
Join our event experts
Watch on-demand webinars and join live sessions with industry leaders sharing best practices for event success.
Guidebook in Action
Book a personalized walkthrough and discover how we help event teams create better attendee experiences.
Guidebook in Action
Book a personalized walkthrough and discover how we help event teams create better attendee experiences.
5 Event App Metrics that Make a Difference


5 Event App Metrics that Make a Difference
- What percentage of users engaged with the app?
- Which features did attendees engage with the most?
- How can I improve my app and event in the future?
- Should I adjust my promotion strategy?
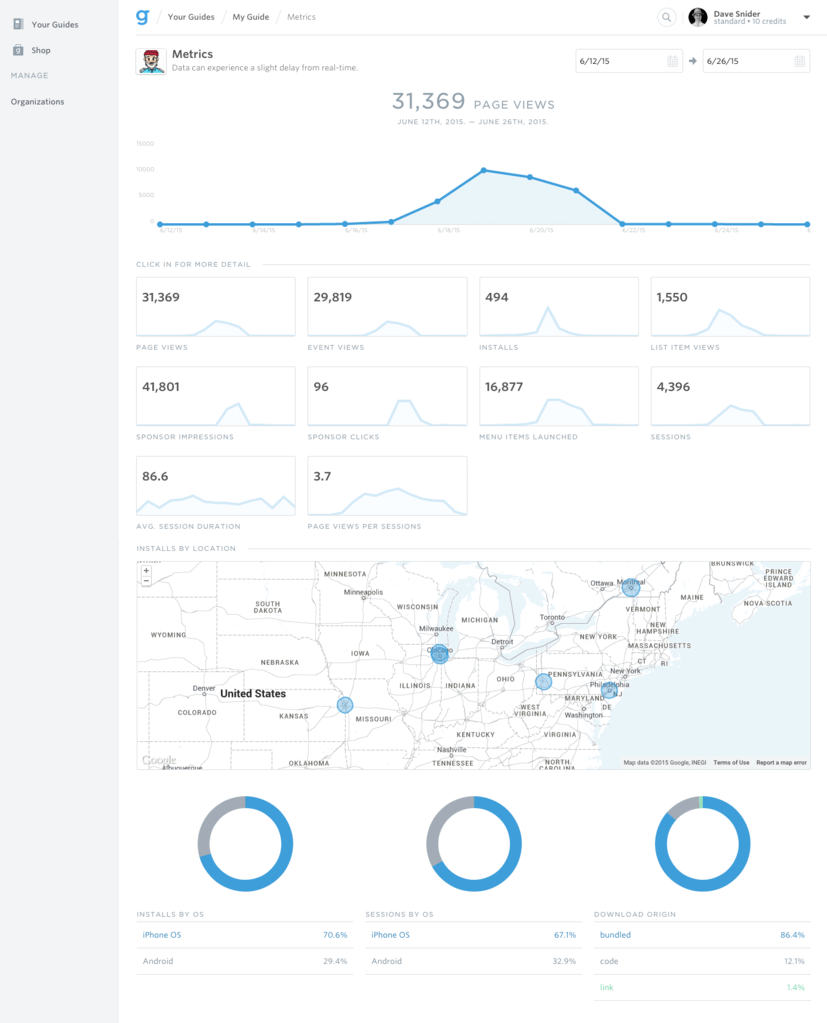
Know what info your audience seeks most
When users select items from your main menu, they’re actually telling you a lot about what type of information they’re looking for when they open up your event app. If your networking features are within the top 5 menu items, you know that one of the main reasons people are attending your event is to connect with one another. If that information is a surprise to you, it’s easy to react and either create more opportunities to network – or optimize your event app to showcase your networking features. Many Guidebook users will use this metric to help them arrange their icons on the menu. The most popular items get priority over others.Identify top sponsors, speakers, and vendors
Lists house some of the most important information in your event app – they are basically the building blocks by which the app is constructed. Sponsors, speakers, and vendors are all cataloged within lists. By measuring the number of times each one of those items is viewed, your event app is effectively able to tell you which of those sponsors, speakers, or vendors are most popular. This can go a long way towards providing ROI statistics to your sponsors or even determining your own ROI on keynote speakers. If you’re looking to gather some data on a specific aspect of your event, try creating a list and cracking open the data. If, for example, you’ve sold a number of food truck slots and wondering which one was most appealing to your attendees – consider making a list of them within the app and analyzing the list item views after the event. The possibilities are endless!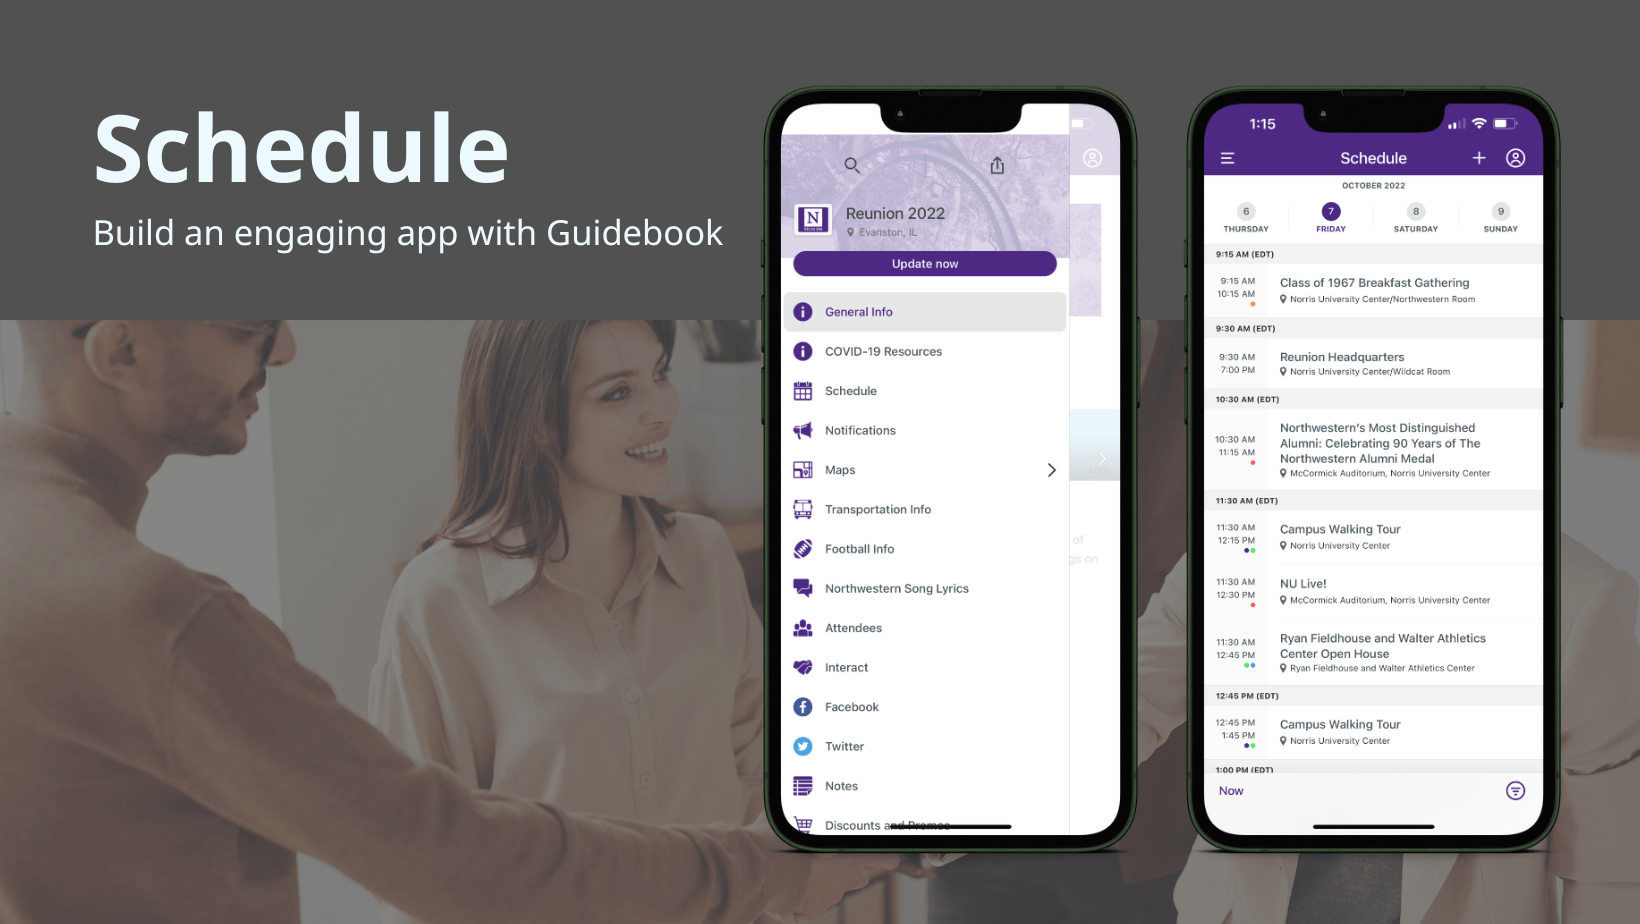
See which sessions resonated with your audience
Just as important as list items are schedule items. If list items are the building blocks of your app, schedule items are the building blocks of the event itself. You’ve spent a ton of time creating a schedule that you think will appeal to your attendees – but the only way to know for sure how attendees are responding to the schedule is by measuring their reactions to it. The top-viewed events can be some of the most useful metrics when optimizing your event. If you check the stats before the event, you might be able to avoid disappointment by adding a second session of a popular schedule item. When you check the stats afterwards, you might be able to narrow down a particular topic that didn’t really resonate with your audience due to its lack of views. Drill down on this engagement metric to determine what resonated with your audience the most. This information can give you a clear picture of what your attendees liked and disliked, which is powerful information that you can use for your next event!Understand device preferences
The type of device your attendees use can actually tell you a lot about who they are. Perhaps most importantly, however, knowing your iPhone v. Android numbers will give you a heads up as to how to optimize your app, mobile site, and other mobile efforts you’re providing at your events. When building your app, previewing it on both an iPhone and an Android phone is a good idea. This will eliminate any surprises of attendees complaining about device issues and you being stuck without a visual to help them troubleshoot.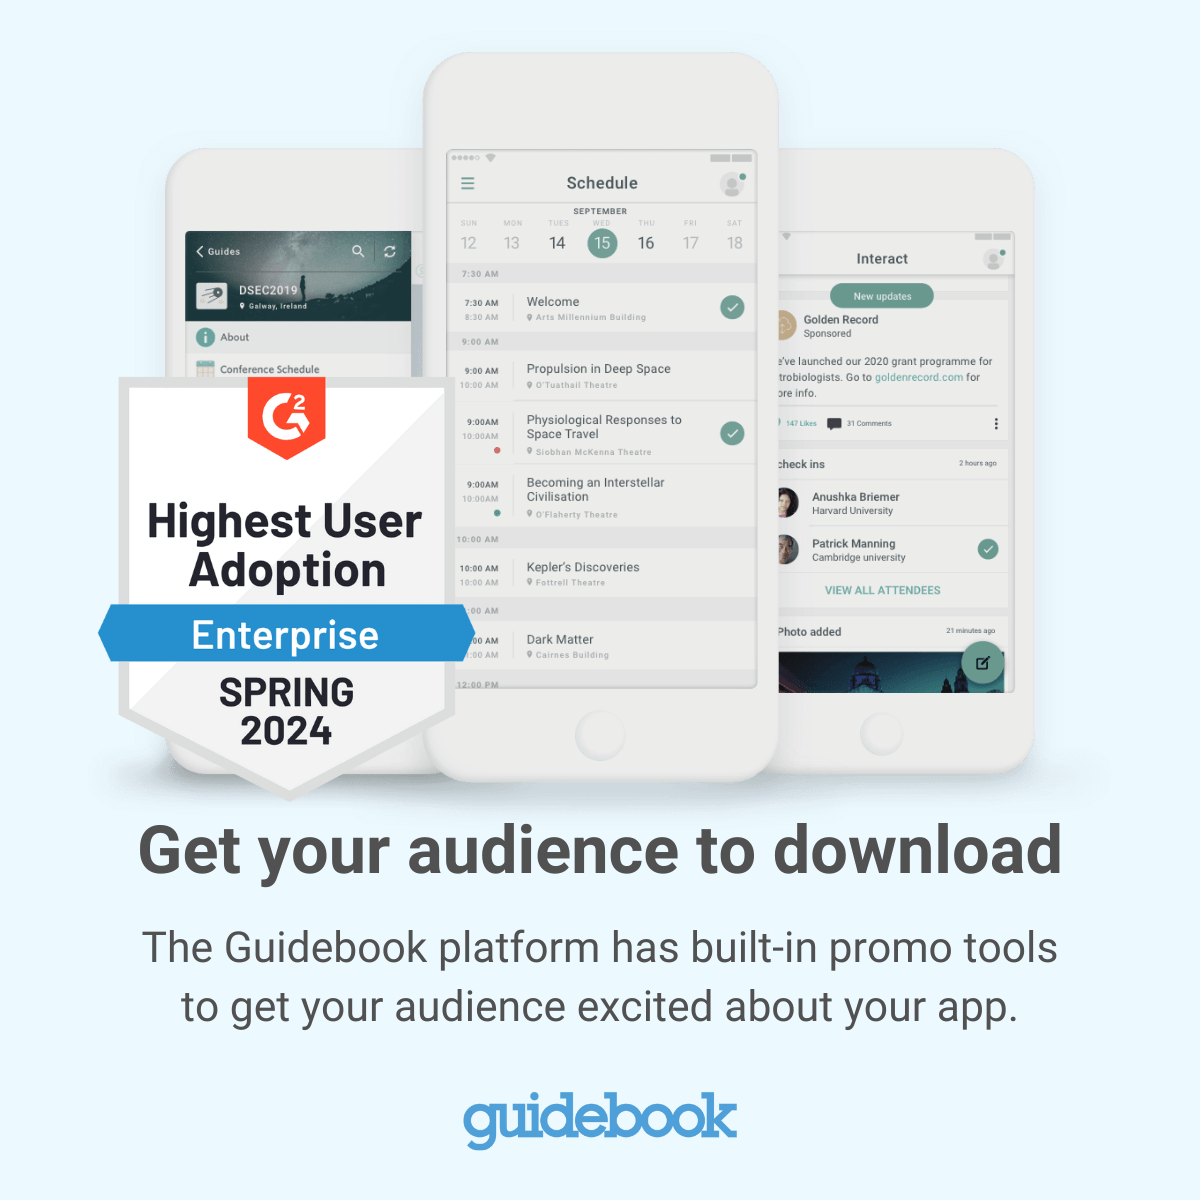
Measure overall app engagement and effectiveness
The highest profile of all event app metrics for determining the overall effectiveness of your app is, of course, app installs or your app adoption rate. Most people who use an event app ask themselves at some point in time, “Was it worth it?” By taking the number app installs and dividing it by your total attendance, you’ll get a percent adoption rate. Percent adoption can tell you how your audience reacted to the idea of an event app and simply answer, “Did my attendees use it?” The only thing to keep in mind with your percent adoption is that sometimes it’s a more accurate measurement of how well you marketed your event app, rather than the effectiveness of the app itself. If you want a fully accurate picture of how many of your attendees will use an event app, make sure you’ve done everything possible to promote it in the first place. You want to make sure that your attendees aren’t just downloading the app and checking it out once -- you want engagement! By looking at your adoption rate as the start of your event nears, you can see if your current promotion strategy is effective and make adjustments if necessary. In general, you want people to download your guide at least two weeks before your event. If you’re ready to turn your attendees’ behaviors into actionable data, start building a guide with Guidebook Builder today. It’s free to try and extremely easy to use!
Plan with Confidence, Not stress
Get the complete event planning checklist with pre-event prep, day-of setup, and post-event follow-up all in one place..


.avif)